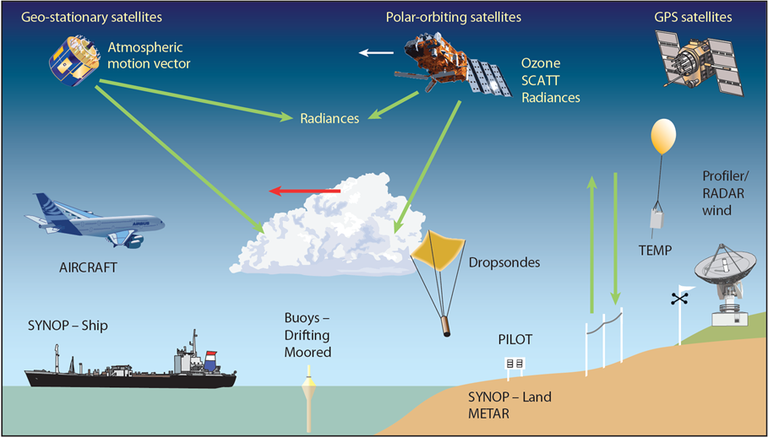
Observations are direct measurements of the Earth’s climate system, collected from instruments like weather stations, satellites, buoys, and aircraft, or from natural records (tree rings, ice cores, and sediments). They provide the foundational data for tracking temperature, precipitation, sea level, and many other variables over time. Observational data is essential for understanding current conditions, validating models, and detecting trends or extremes. Observations are the most direct and accurate representation of what is happening but can have gaps, especially in remote areas, hard to measure variables or over long time scales.
Note that all information given here is collected through individual contributions from ESMO SSG members and other participants. If you would like to suggest some additions or contribute to the page, please do so using this googledoc. https://docs.google.com/document/d/1Tu-7f4RrWCQzGuJ7lTxqb6aiZBJb1V5a0duEsKAp72c/edit?usp=sharing. If you are not able to access the googledoc, you can also send your suggestions over email.
Important Data links and catalogues
You can find important observational data records through the following links.
- ECV Inventory (CEOS/CGMS) - The Essential Climate Variables (ECV) Inventory houses existing and planned data records from various space agencies.
- The Earth Science Data Systems (ESDS) Program - provides open access to NASA’s archive of Earth science data, empowering researchers and decision makers to better understand and protect our home planet.
- Met Office Hadley Centre observations datasets - Researchers at the Met Office Hadley Centre produce and maintain a range of gridded datasets of meteorological variables for use in climate monitoring and climate research.
- Copernicus Data Space Ecosystem | Europe's eyes on Earth
- National Oceanic and Atmospheric Administration (NOAA) | List of NOAA Open Data Dissemination Program Datasets
- WMO (often in situ coordination) hosts GCOS (also GOOS, GTOS and the GAW) Climate observation networks | World Meteorological Organization
- ARGO Training: The Argo Online School — Argo Online School
Other resources
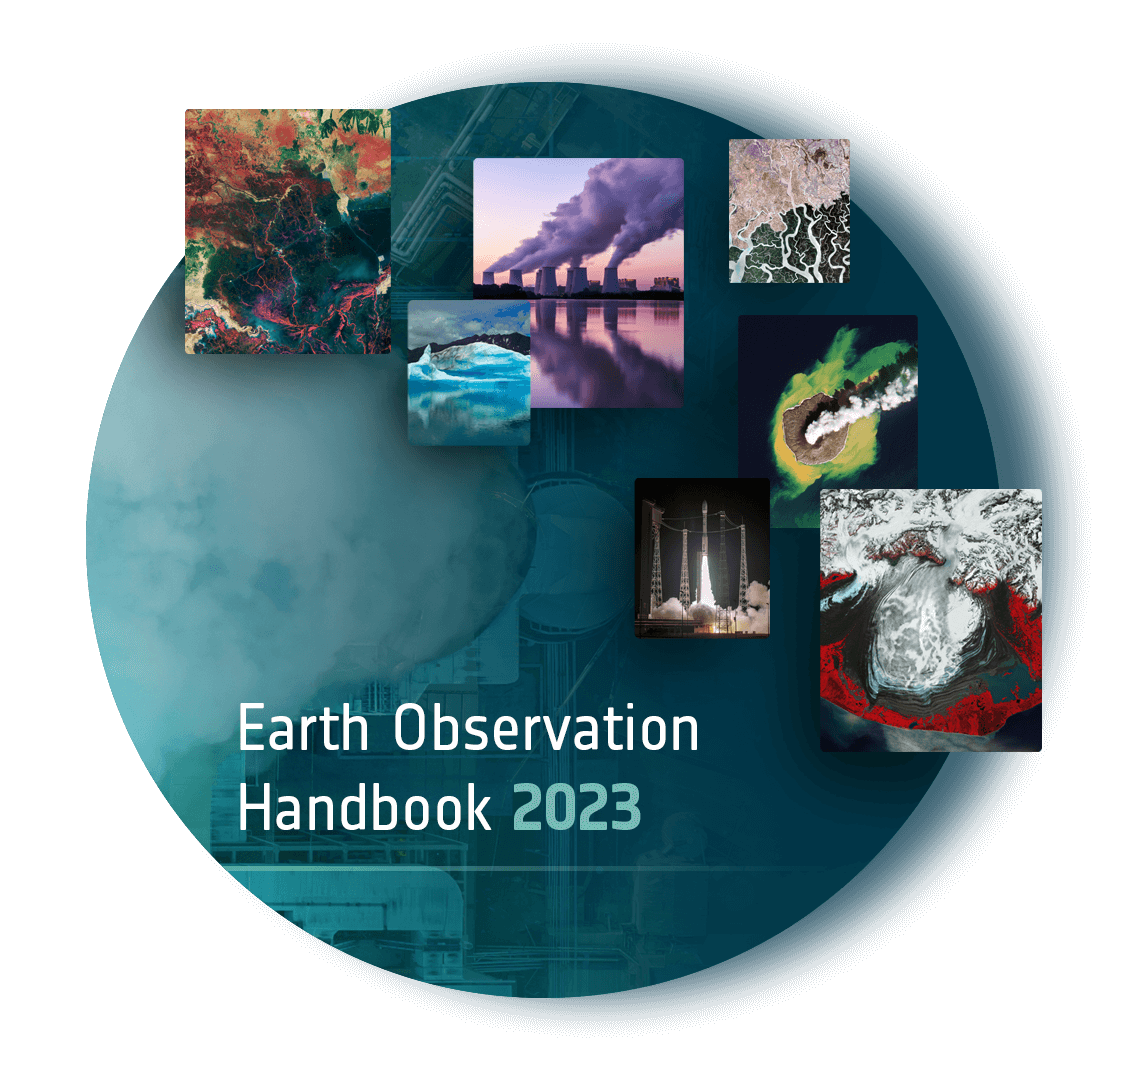
The Earth Observation Handbook
The CEOS Earth Observation Handbook presents the main capabilities of satellite Earth observations, their applications and a systematic overview of present and planned CEOS agency Earth observation satellite missions and their instruments.
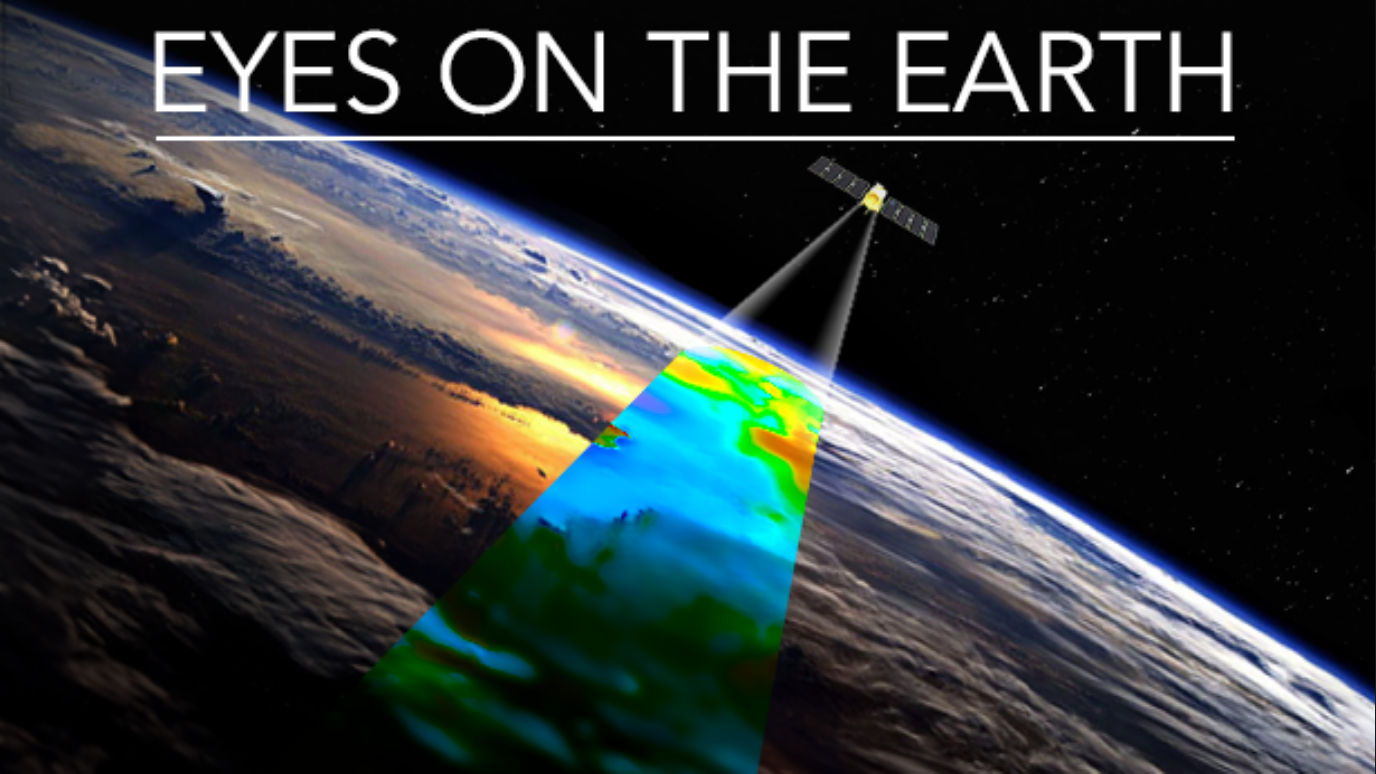
NASA Eyes on the Earth
Fly along with NASA's Earth science missions in real-time, monitor Earth's vital signs like Carbon Dioxide, Ozone and Sea Level, and see satellite imagery of the latest major weather events, all in an immersive, 3D environment.
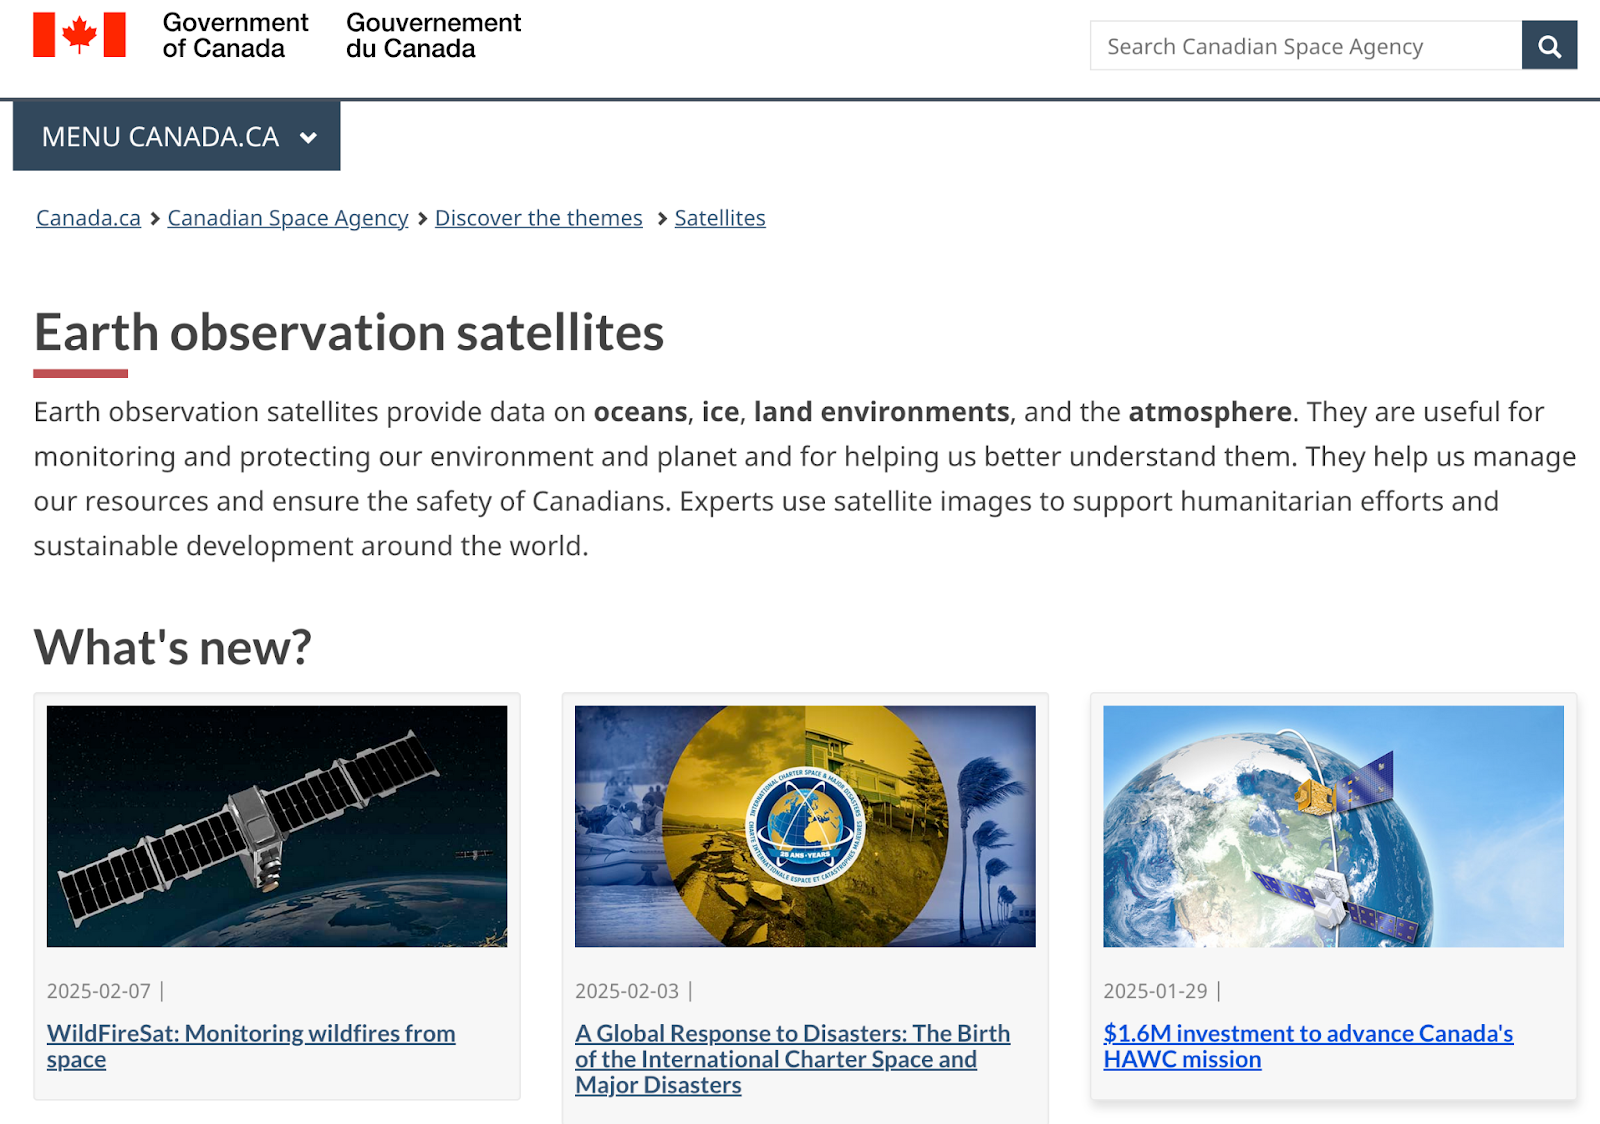
CSA page on Earth Observation Satellites
Learn how Earth observation satellites provide data on oceans, ice, land environments, and the atmosphere, or explore different satellite missions that are operated or supported by the Canadian space agency.
Important Observation related terms
These are some concepts that are specifically important in relation to observations.
- Metadata - Descriptive info about data (e.g., instrument type, location, calibration history) that's crucial for proper interpretation.
- Proxy Data - Indirect climate evidence (e.g., tree rings, ice cores) used to infer past climate conditions before modern instruments.
- Quality Control (QC) Flags- Indicators attached to data points that flag potential issues like errors, gaps, or suspect readings.
- Coverage Bias - Gaps or uneven distribution in spatial or temporal data that affect the representativeness of observations.
- Reprocessing - Re-analysis of raw observational data using updated algorithms or corrections to improve accuracy and consistency.
- Ground Truthing - Using direct, on-the-ground measurements to validate or calibrate remote sensing data, often from satellites.
- Instrument Drift - Gradual changes in instrument response over time, affecting long-term measurement consistency.
- Homogenization - Techniques used to adjust observational time series to account for non-climate-related changes (like station relocations or equipment updates).
- Radiometric Calibration - The process of converting raw satellite sensor data into physical units like temperature or radiation.
- Inhomogeneities - Discontinuities or biases in a climate record caused by changes in instruments, observing practices, or environment.
Visualisers and APIs
- C3S
- CCI Toolbox
- Google Earth Engine Training 2022
- Nasa Earthdata
Further information and training links
Overview of observation types
Determining what observation you need:
- Temporal coverage (period of measurement)
- Temporal resolution (timestep)
- Delay in availability [explainer: Near Real-Time Versus Standard Data Products | NASA Earthdata]
- Spatial resolution / Grid size / Not gridded / point data
- Spatial coverage (Global/regional/polar)
Other constraints to consider
- To make a useful dataset from measurements, data needs to be proceseed e.g. be on a regular grid, be validated etc.
- Time period: EO (Earth Obs) only goes back to the 70s at best, and new instruments are much better than older ones. For long records especially, be aware that several satellites must be stitched together (and for even longer records, combined with in-situ obs). This has an impact on which features can be resolved and things like gaps and the variability characteristics of the data through time
- Timestep: depends on the underlying data source, although the relationship is not necessarily simple, particularly for in situ/point measurements where the representativeness of the observation over a wider area must be considered – an explainer from ARGO here
- Resolution – data volume as well as your intended purpose is a consideration here.Global/regional coverage– in addition to your needs, data quality may vary as a function of location (e.g. for many satellite products, observations can only be made for clear sky, so there may be larger uncertainties or fewer observation at some times of year in some locations). For in situ observations, typically the southern hemisphere is less well sampled than the northern
In situ observations
- Ocean/Argo explainer: In Situ | CMEMS; Operational Oceanography | CMEMS
- Various WMO networks: eg GAW Global Atmosphere Watch Programme (GAW) | World Meteorological Organization
Data record types
How we combine the information we collect depends, in part, on what we intend to do with it. (ie. observations are often combined for a specific purpose e.g. data assimilation).
Climate scale observations (WGCM related)
- What observations are essential for monitoring our climate Essential Variables | NASA Earthdata Similarly from the ESA page: Climate data records at a glance
- Others: Climate Data Records | National Centers for Environmental Information (NCEI) Climate Data Records: Overview | Climate Data Guide
- Training: https://www.imperativemoocs.com/courses/monitoring-climate-from-spaceHow we define Climate data recordsTerminology – Climate Monitoring from Space – Joint CEOS/CGMS Working Group
- GCOS 2021 The Global Climate Observing System 2021: The GCOS Status Report and the new approach On the Determination of GCOS ECV Product Requirements for Climate Applications in: Bulletin of the American Meteorological Society Volume 106 Issue 5 (2025) (may be to technical for this page, but it would be really nice to have more people on the modelling side be aware of this discussion)
NWP scale observations (WGNE related)
Explainer: Near Real-Time Versus Standard Data Products | NASA Earthdata
Observations for modellers
- For model evaluation
- CMIP REF
- ESMValTool,
- PCMDI metrics (and the other ref -related packages)
- Forcing, assimilation and initialisation
- CMIP forcing pages (coming soon?)
- High resolution modelling – evaluation
- Process studies?
- How are observations used in reanalysis
- Specific data needs for reanalysis – e.g. presence of uncertainties, observational thinning vs super-observations, assimilation of emissions vs concentrations vs BT etc
- Explainer: what is reanalysis Fact sheet: Reanalysis | ECMWF
- Climate reanalysis | Copernicus
Other info:
Data Rescue / Citizen Science
- C3S Data Rescue Service | DataRescue
- ESA heritage space: Heritage Missions - Earth Online
- SST project by Ed Hawkins: GloSAT | Global Surface Air Temperature
- How do we know what we have measured (uncertainty): Climate Data Records from Satellites: A Metrological Approach – NPL Training
- Home | COMET
- Resources | CEOS | Committee on Earth Observation Satellites
- EO College
- WCRP Academy_FirstStocktakeSurvey_FinalFindings_31May2022